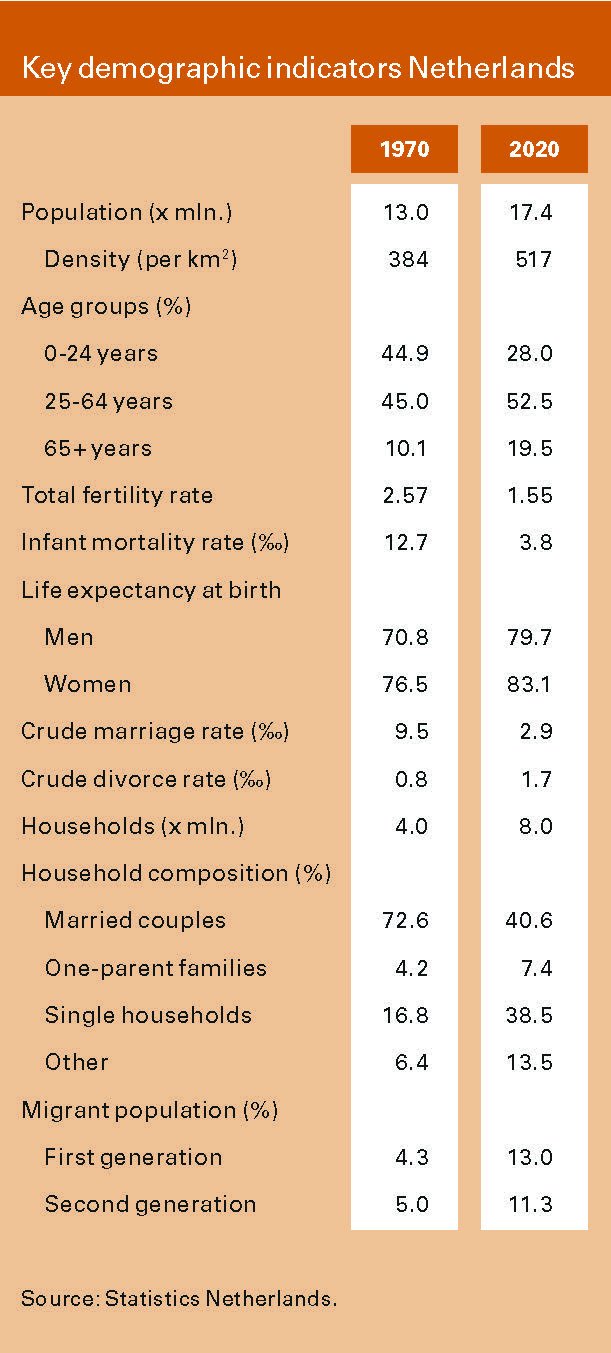
In 1970 the Netherlands had 13 million inhabitants and Statistics Netherlands back then forecasted 21 million inhabitants around the year 2000. However, the population increased to ‘only’ 17.4 million in 2020. In that period, 9.4 million people were born, 6.1 million immigrated, 4.6 million emigrated, and 6.5 million people died. Population density increased from 384 to 517 per square kilometer.
The age structure of the population of the Netherlands transformed from a young population to a relatively old population. This was mainly due to a strong decline in the birth rate in the mid-1970s, and therefore lower numbers of births on the one hand, and decreasing mortality rates and therefore increased life expectancy on the other. Although the total population was considerably smaller in 1970, there were more children and youngsters than in 2020. Almost 45 per cent of the population in 1970 was younger than 25 years of age, compared to 28 per cent in 2020. The average number of children per woman decreased from 2.6 in 1970 to 1.6 nowadays. The population aged 65 years and over increased from 1.3 to 3.4 million. The number of persons aged 80 years and over nearly quadrupled from 222 thousand to 822 thousand. Life expectancy at birth increased from 71 to 80 years for men and from 76 to 83 years for women. Life expectancy has risen substantially at higher ages: life expectancy at both age 65 and age 80 is now about 30 to 40 per cent higher than in 1970.
In 1970, unmarried cohabitation and divorce were relatively uncommon. At the time, almost 73 per cent of all households were married couples; in 2020 this had dropped to 41 per cent. Today, 13 per cent of households are unmarried couples. One-parent families were also less common back then (4%) than now (7%). But especially the number of one-person households has increased enormously, from 680 thousand (17%) back then to more than 3 million (39%) now.
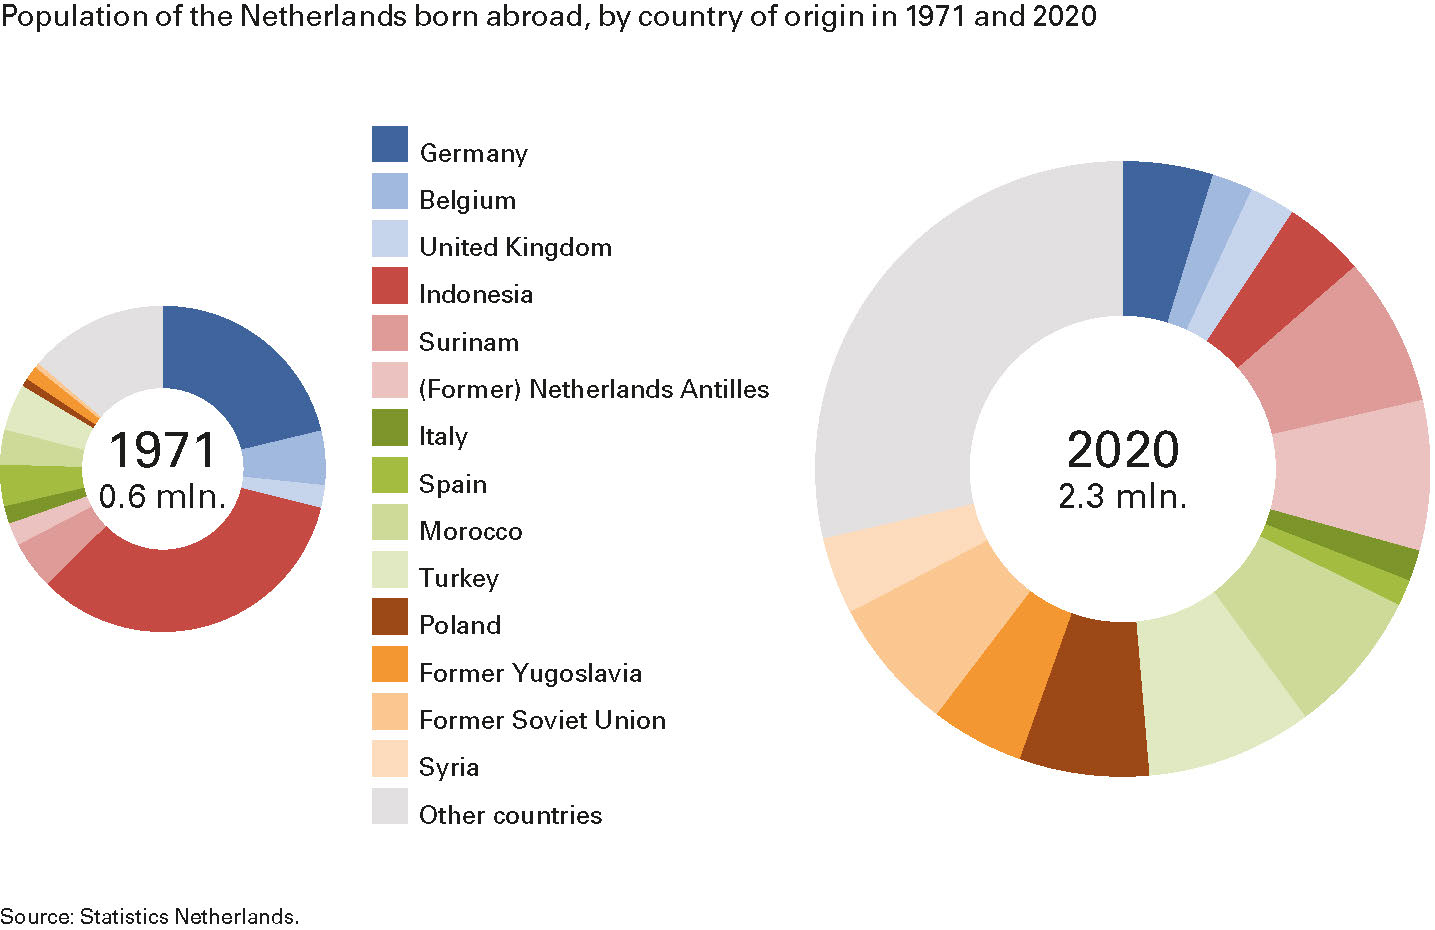
In 1970 less than 5 per cent of the population was born outside the Netherlands, the largest groups of these first-generation migrants originating from the (former) Dutch colonies (especially Dutch East Indies/Indonesia), the neighbouring countries (especially Germany), and the Mediterranean (mainly labour migrants). In 2020, by contrast, 13 per cent of Dutch citizens were born outside the Netherlands. The composition of this group has also changed significantly, with the largest groups now originating from Turkey, Morocco, Surinam, the (former) Netherlands Antilles, and Eastern Europe. The second-generation migrant population increased from 5 to 11 per cent.
Population growth mainly concentrated in planned new towns, like Almere and Zoetermeer, and suburbs around the large cities. However, the population size within the largest cities hardly increased (Amsterdam) or even declined (The Hague and Rotterdam): until the mid- 1980s population in the major cities decreased by around 20 per cent and it was not until after 2000 that population size started to recover again. Population decline regions are found in the peripheral far northeast, southeast, and southwest of the country.
In the past fifty years, the demographic landscape of the Netherlands has changed considerably. Although the demographic future is of course uncertain, the projected trends of a recent scenario study for 2050 (see this Demos article) seamlessly fit with the changes over the past fifty years towards an even more crowded, aged and diverse society.
Peter Ekamper, NIDI-KNAW/University of Groningen, e-mail: ekamper@nidi.nl
Literature
Ekamper, P. (2020), Vijftig jaar demografische verandering. Demos, 36 (10), pp. 1-4.